Determining factors for an a priori, probabilistic prediction in League of Legends
Whoa there Charles Dickens, I didn't come here to read a novel!
Although casual in tone, this is an academic treatise and there is a good chance you may learn something in the process. But if I cannot sway you to stay the course, you can just skip to the TL;DR Summary
Purpose
I would have the studies elective. Scholarship is to be created not by compulsion, but by awakening a pure interest in knowledge. The wise instructor accomplishes this by opening to his pupils precisely the attractions the study has for himself.
This document and software serves several concurrent purposes,
- To learn and teach about probabilistic analysis and simulation,
- To engage the developer community and meta surrounding League of Legends,
- To compete in the Riot API Challenge
Background
League of Legends is a popular online multiplayer game developed by Riot Games. In normal play, the game pits two teams of 5 players against each other. Each player selects one of 124 possible characters (called champions), each of which has various strengths and weaknesses. Each champion has four abilities (such as a special attack or a healing spell) that can be activated by the player. Each ability has a limit on how long the player must wait before using that ability again, called a cooldown. The requisite time can range from a seconds to several minutes.
As both an April Fool's joke and a way to keep the game fun and interesting, Riot re-released the Ultra Rapid Fire (URF) Mode, best described by gaming website Kotaku:
The attack speed, movement speed, critical strike damage, and the rate at which players' characters in the game farmed gold were all bumped up. The cooldown times and mana costs for their special abilities were also decreased to such an extent that players could spend an entire game spamming their champions' most powerful attacks against one another every few seconds.
URF took everything that was normally meant to be carefully managed in League and handed it to its players in abundance. [Riot] threw caution to the wind in turn. Champions were suddenly able to wail on each other nonstop for the length of a whole game.
Proabalistic forecasts for mutually exclusive outcomes
The classic problem in this space thus: 'There's a 70% chance of rain on Thursday.' If it rains, you say it was a decent prediction, but if you are left high and dry by Friday, you can still say you are right, since it won't rain 3 times out 10. The challenges to this kind of problem include
- the forecast is itself a expressed as chance (a probability of the event occurring),
- you only have one observation, and the outcome is mutually exclusive (either it rained or it did not), and
- the exact conditions may not appear again to test the prediction multiple times over.
We run into this same situation in League of Legends. Since there are two teams in each match (and no ties), there is a boolean outcome (either Red or Blue team must win), and we are highly unlikely to ever see a second match with the exact same set of players, skills and champions in the same positions.
Brier score
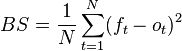
The Brier Score is a method to measure the accuracy of predictions expresses probabilities when their outcomes are mutually exclusive and discrete. You can calculate this by summing the square of the differences between the predicted probability and the observed outcome (as 0 or 1), divided by the number of observations:
Attribution: Wikipedia
In League of Legends, we have one additional challenge in this area: the fact that nominal outcome of a match is 50-50. This also means that any probabilistic predictor must be better calibrated than a coin flip (e.g. a Brier Score lower than 0.25) to be declared a meaningful tool.
A priori versus a posteriori analysis
Although several websites (such as League of Graphs) have shown that the probability of winning can be well-correlated to key events during the game, there is scant research on whether the outcome can be predicted accurately a priori - i.e. predicted before the match starts.
We largely ignore the timeline events in the match payload, because we mostly concerned with who the players are, which champions they pick, and what the final outcome was. Our goal therefore is to find a way to estimate a team's chances of winning based solely on their inputs, not their gameplay or execution. This seems particularly relevant in URF mode, since resources are abundant while both skill nor strategy are reduced factors. For example, in tournament play a well-timed skill shot can change the course of a battle. But in URF mode, a missed skill shot can just be followed by several more! Furthermore URF mode laning phases are easier and likely to be less critical to the acquisition of gold and creating an early advantage.
Approach
- Download as much URF mode match data as possible.
- Analyze the factors that contribute to winning URF mode matches.
- Create estimators based on the strongest factors.
- Implement a deterministic simulations to provide probabilistic outcomes.
Analysis of winning factors
Champion selection
With 124 champions to choose from, there are over 27 billion ways to choose a single 5 man team, and over 700 quintillion (729,972,479,623,688,294,400) possible 5v5 match ups (in blind pick mode). In the 110,000 downloaded URF mode matches, we only saw only a tiny fraction of the total possibilities. Although it is apparent from gameplay that teams exhibit synergies or dissonance based on composition, the first analysis will have to focus on individual champions rather than the team collectively.
Since URF mode is blind-pick, there is a fair chance that a single champion will appear on both teams. When this occurs we have three options when calculating the win rate:
-
Wins divided by wins plus losses.
This metric best reports the champion's performance without regard to matches. The metric can be used as a probability since
win% + loss% = 1,However, this metric understates the effectiveness when comparing two champions because the denominator 'double counts' a single match when the champion appears on both teams. This metric
-
Wins divided by number of matches where the champion is present at least once.
This causes
1 <= wins% + loss% <= 2and creates 'noisy' and quixotical results such as in the case of a perfect mirror match: each champion would have both a 100% win and 100% loss rate. -
Wins divided by wins plus losses but ignore any duplicate champions in a single match.
For most analyses, we choose this option since the mirror match provides no meaningful information as which of the two would win when comparing team compositions on an individual basis. This metric still retains the property that the sum of all probabilities is 1.
Using the 3rd method of counting champion win rates showed a strong normal distribution . All but 12 champions had a win rate between 45 and 55%. The average win rate was only 49%. Only 53 out of 124 champions (42.7%) had a winning record.
The first attempt was to build an estimator that relies entirely on character win rates to compute a team's chance at victory. Despite several attempts, none had resounding success.
| Algoritm | Brier Score | Raw Accuracy |
|---|---|---|
Linear (cumulative)
01_linear
|
0.248 | 57.8% |
Linear (multiplicative)
01_linear_mult
|
0.241 | 57.9% |
Standard deviation (cumulative)
05_standard_deviation_mult
|
0.244 | 57.9% |
Standard deviation (multiplicative)
05_standard_deviation
|
0.239 | 57.7% |
Given that a coin-flip would provide an accuracy of 50% and Brier score of 0.25, none of these algorithms are particularly well calibrated.
Player experience
Given the wide range of players in League of Legends, the next variable to consider whether player experience contributes to victory. There are two obvious challenges in this analysis.
First, the anonymous data for URF mode matches did not include the player's identity, so additional details about the player were unavailable. An attribute such as total matches or victories would be a strong indicator of experience and/or dedication to the game but that statistic is not available to us. We only have two relevant attributes, player level and the 'highest rank achieved' in this Season of play was included in the payload, which will have to stand as proxy for the skill of the player.
Second, Riot already uses an algorithm to match teams with similarly skilled players, which makes analyzing disparity more difficult.
Even with these limitations the data show several interesting results. By assigning 'points' to each of the 8 ranks ( Unranked, Bronze, Silver, Gold, etc ), we can calculate the weight of each team. Probability of greater differences between team strength decreases logrithmically . One fifth of matches were evenly in points, and over 70% had a difference of less than 4 points. This demonstrates that the matching system is quite fair.
When we graph percent of upsets versus team rank, we see a pattern. For each point of rank disparity the stronger team gained a +1% improved chance to win. Although the number of disparate team matches drops off quickly, the pattern holds. Even in the long tail, we have 13 matches out of 110359 with a disparity above 14 (the equivalent of an all-Gold team versus an all-Unranked team), and the stronger teams had extremely high win rates over their weaker opponents. Is it possible that higher ranked players simply chose better (or more winning) characters? A simple linear regression of player rank versus win rates shows a slope of -0.00038 - essentially, zero. We conclude that in general, the benefits of rank disparity between teams in a match are not connected to champion selection.
(Not all that glitters is) Gold
If you're 50 gold short for an item, kill the enemy nexus.
The League community recognizes that gold is a strong indicator of which team is ahead during a match. This is justified by the virtuous cycle whereby gold buys better items, which improves performance against creeps and other players, both of which provide gold when killed. However, gold in URF mode is relatively easy to acquire and champions can achieve full builds in a fraction of the time required in a Normal game.
Even so, does a gold advantage determine the winner?
| Algorithm | Brier Score | Raw Accuracy |
|---|---|---|
Relative Gold Advantage
06_gold_predictor
|
0.230 | 51.0% |
Abolute (Boolean) Gold Advantage
06_gold_predictor
|
0.206 | 51.0% |
The answer is no, but sadly we find our best calibrated estimator yet - the team with the most gold is more closely calibrated to determining the winner. This is likely due to the near 50% odds that the estimator provides.
There are a few deficits in this analysis. Excess gold beyond a character's final build is not likely to be strongly indicative of a winning position. There is no understanding as to where the gold came from (creeps, objectives, kills), which have a strong affect on the balance (and thus victory) in the game. Lastly, the winning team will usually acquire gold in the final push into the enemy base, which means the winning team already gets a bias in the final gold results.
Conclusions
Failure is always an option.
None of the factors explored provided enough information to build a coherent model for predicting the a priori winner. We were close to matching some early game a posteriori predictions, such as First Blood, but additional research will be required to find a factor or combination of factors that can provide a better estimator.
It could also be the case that the Brier Score is a poor choice for scoring the prediction in League of Legends. There is active debate that the Brier score favors "safe" prediction and inherently discourages prediction outside of the a widely expected value - of which 50-50% is a fantastic prediction for two evenly-matched teams in League of Legends.
Furthermore a log likelihood scoring method may be superior when the outcome is heavily favored one direction. Given the game's positive-feedback cycle and anecdotal correlations between game events and outcome, we may need to explore other scoring mechanisms.
A tour of the code
The github repository contains three unique branches.
Branch: dataminer
Dataminer's sole purpose was to extract as much data from the Riot API endpoints as possible. Developer tokens are limited to 10 requests in 10 second or 500 requests in 10 minutes. The dataminer throttles requests to the slower of the two limits - one request every 1.25 seconds.
The main loop is straightforward: query the new
api-challenge
endpoint for URF mode matches, then call the
match
api iteratively for any matches not yet downloaded.
Branch: master
The master branch contains a rails application used in processing data. We use mongoid to load data into mongodb, then process match data into meaningful collections. Most of the map-reduce work is done by hand rather than aggregation pipeline in order to facilitate debugging and ease of change.
Scripts in
/bin/ops
load data or create subsequent collection that are needed for later processing. Analysis scripts that test outcomes are located in
/bin/analysis
At one point there was some consideration of making the rails branch an interactive application for end-use and deploying the project a la carry.gg, but we could not collect enough data and build a model fast enough (or fast enough model) to provide real-time feedback on games just starting.
The web framework is Twitter Bootstrap 3, assets (namely d3.js) are marshaled via bower. You'll also need the aforementioned mongodb to run the app.
Branch: gh-pages
Although the underlying tool is a rails app, all pages are static once the data is generated, so the resultant pages were collected and uploaded as static resources. This branch should have been created from a static site generator such as middleman, but since the rails app already had all the necessary resources, scraping its output was easier than creating yet a third project.
Closing
Special Thanks
Dr. Henry Bryant, for the resources on stochastic simulation and probabilistic analysis.
My WoW guild, Vanquish @ Firetree, especially Jakeswims (for starting me on League), and maybe Browniess (for chewing me out about landing Q's as Morgana).
About the Author
Craig is a fan of many video games and hard challenges, a full time nerds and definitely one of the crazy ones. He's a former Senior DevOps Engineer for Apple, and is currently a staff member in the Agricultural and Food Policy Center at Texas A&M University, a Research and Extension Services unit in the department of Department of Agricultural Economics.
TL;DR Summary
Who were the best/worst champions in URF mode?
Sona is a winning outlier, followed by Jax and Wukong. Thresh and Bard performed very poorly.
All but 12 (or 19) champions were within 45-55% - the percentages depend slightly on how you interpret data from mirror match ups.
Were the games 'won or lost at champion select'?
No.
Although the champion win rates had a nice bell-curve shape, only 53 (43%) of the 124 champions had overall winning records. But most of the champions were close to the average of 49.4%. From just the champion selection alone, we can successfully predict the winner of a match 58% of the time, but it's a poor guess.
Did higher-ranked players win more?
Yes and No.
Equally ranked teams were even across the board, regardless of the team's total experience. However, for each rank of disparity over the opposition, the team increased their chances of winning by 1%.
How often did we have a large disparity in team rank?
Very rarely.
Riot's team matching system closely matches teams with similar experience/skill; the chance of a sizable difference in combined team rank decreases exponentially.
Did better players pick better champions?
No.
The correlation between rank and champion win rates was all but 0. Ranked players chose neither better nor worse than everyone else.
Can you predict the outcome of a game before it starts?
Not well.
Some estimates approach 60% accuracy, but our calibration score for nearly every metric was not encouraging. But it could be that the way we scored the probabilities did not work thanks to the heavy snowball effect and two-team nature of matches.
Can you predict Ranked games?
Not yet.
But the research suggests the model could be adapted to predict some aspects of Normal mode games. URF mode simplifies (or removes) many of the essential factors in Normal mode play - important things like strategy and managing resources. :) This 'simplification' didn't actually help in modeling, but there is no reason to think that the more complex space of Normal mode would be much worse.